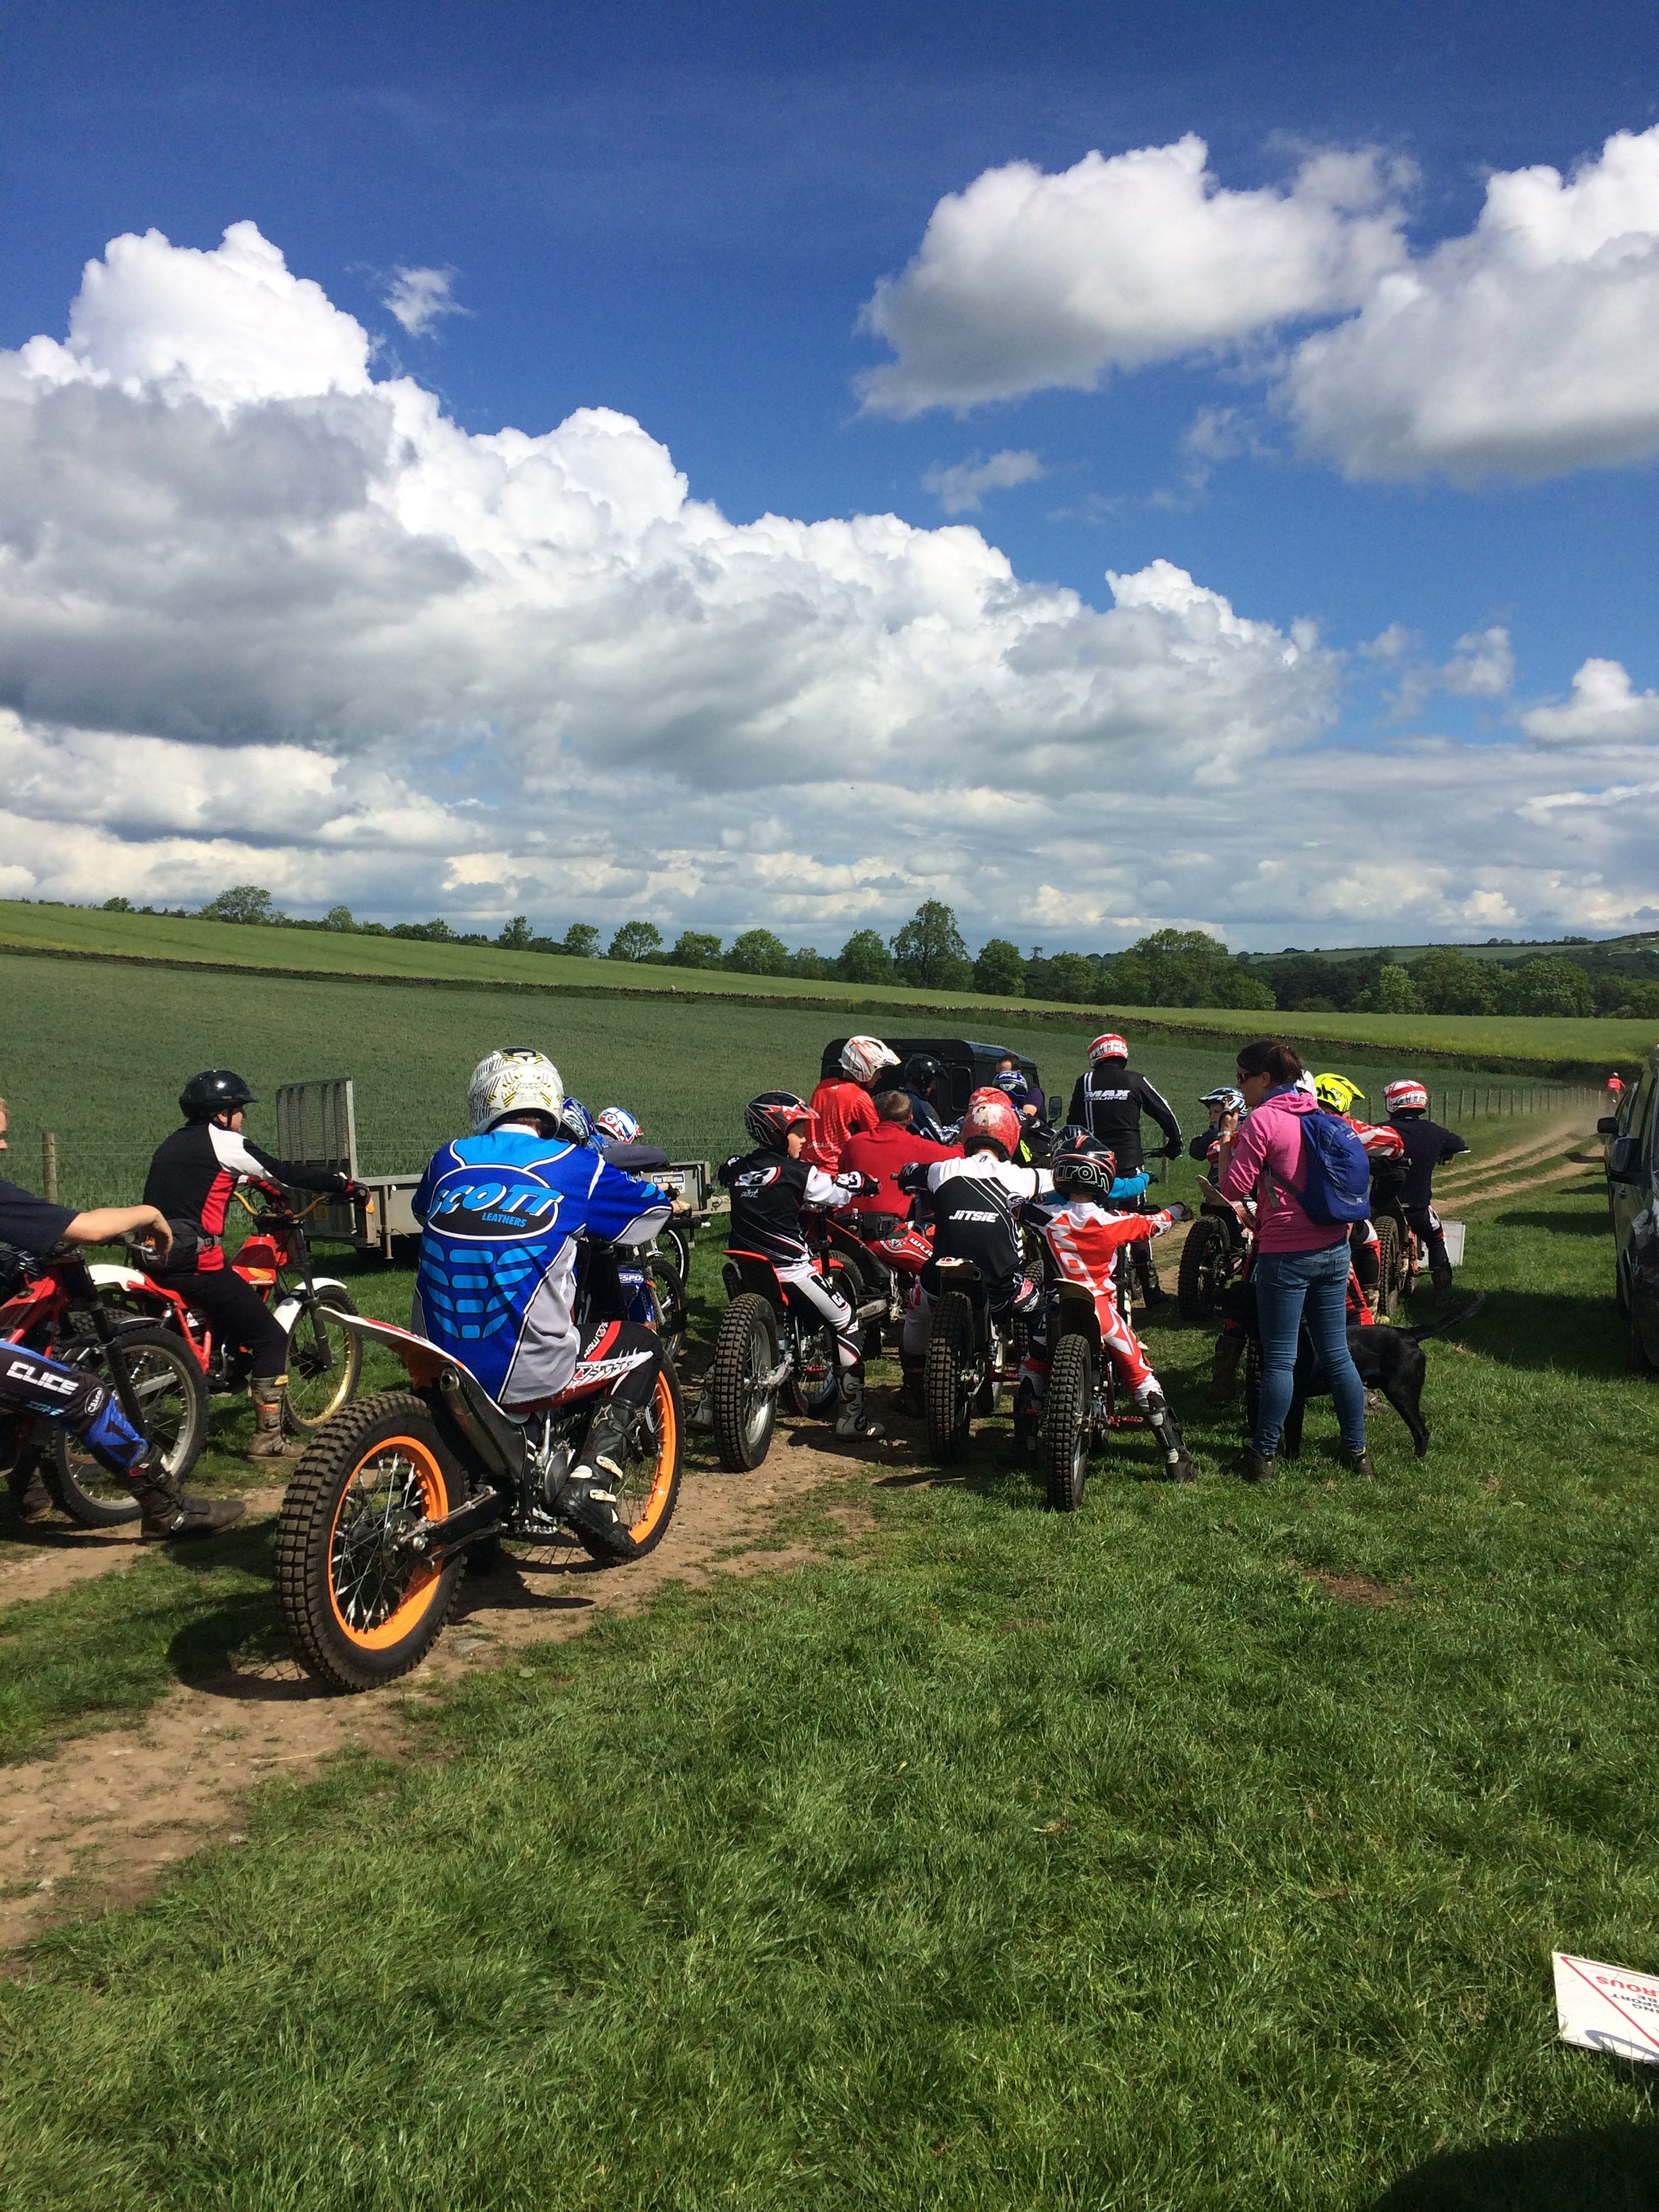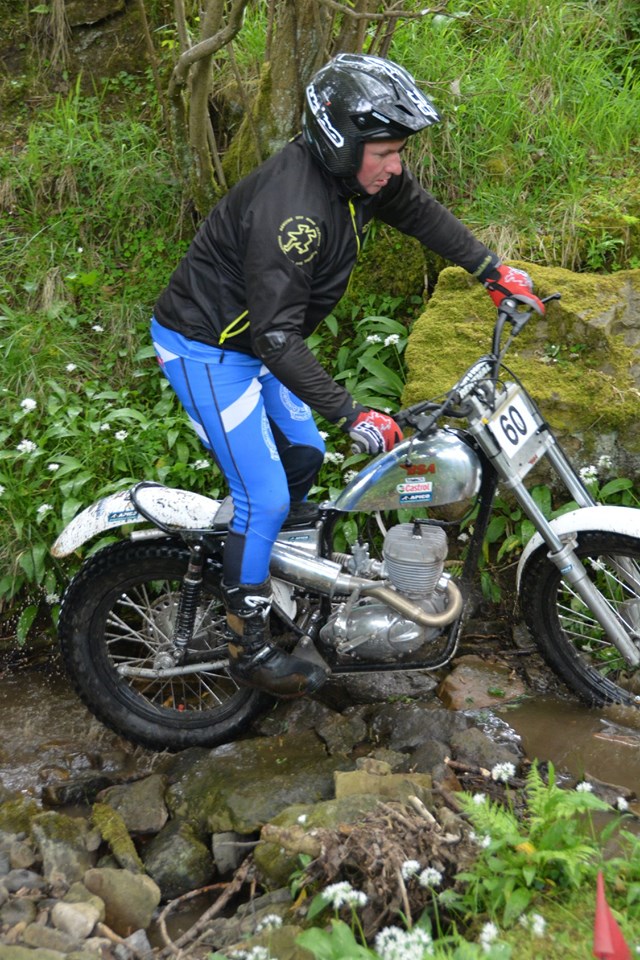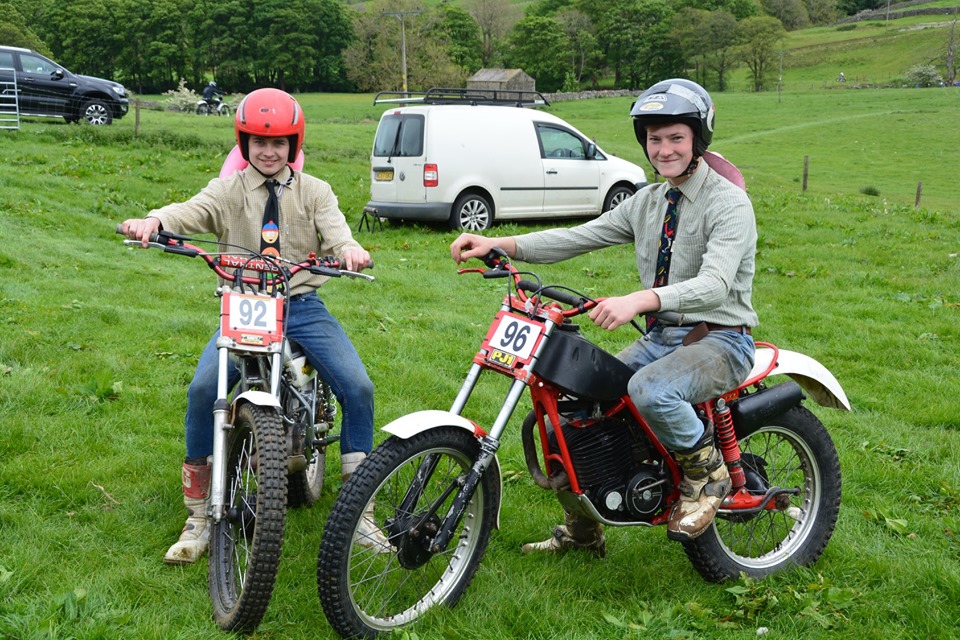
BLUE BAR 2 DAY TRIAL PROVISIONAL RESULTS, ACU:207391, 23+24.5.2026

Please find attached provisional results for the Blue Bar 2 Day Trial:

Blue Bar 2026 Results

Congratulations to all the Class winners.

Richmond Motor Club would like to thank the landowner, observers for observing, Media, the Clerk of the Course and his helpers and anyone else involved in the running of the trial.  Also thank you to all the riders for entering and taking part.

Rob Blueman’s pictures can be found HERE

Charlotte Browns’s pictures can be found HERE

Our next events can be found on our website. 

Thank you

Any problems contact Sandra on: 07719921154

use bias betting UK greyhound trap

Why the Trap Draw Matters More Than You Think

Look: most punters treat the trap draw like a lottery ticket, but it’s a data mine. In the UK greyhound scene, the trap you get can shave seconds off a run or add a fatal lag.

Understanding the Bias

Here is the deal: certain tracks favor inside lanes, others love the outer edge. It isn’t random; it’s physics, wind, even the shape of the rail. If you ignore that, you’re betting blind.

Spotting the Sweet Spot

By the way, the sweet spot isn’t a static number. It shifts night to night, depending on the hare’s speed and the surface moisture. You need a live feed, not a static chart.

Tools of the Trade

Use bias betting UK greyhound trapuse bias betting UK greyhound trap data from the official track releases, overlay it with historic win percentages, then filter for the dogs that actually love that trap.

Common Pitfalls

And here is why newbies lose: they chase the favourite, forgetting the trap can nullify a star’s advantage. They also double-count the bias, stacking it with form and ending up over-weighted.

Actionable Edge

Quick tip: before each race, note the last five trap draws, calculate the win ratio per trap, and bet only when a trap’s win rate exceeds 20% above the track average. That’s the edge.

Greyhound Trap Statistics in the UK: What the Numbers Reveal

Why the Trap Matters

Look: the trap you pick can make or break a race, and the data backs it up. A split-second difference between trap 1 and trap 5 often decides whether a dog snags the win or fades to the back. The raw numbers are stark — dogs in the inside traps win roughly 30 % more often than those on the outer edge, a gap that widens on tighter bends.

Breaking Down the Data

Here’s the deal: over the last five seasons, the average win rate for trap 1 sits at 22.8 %, while trap 6 languishes around 11.3 %. That’s not a fluke; it’s a pattern baked into the track geometry. On oval circuits with a 400-meter circumference, the inside line offers a shorter radius, shaving precious metres off the distance. On straight-only tracks, the disparity shrinks, but never disappears.

Seasonal Swings

By the way, rain can flip the script. Wet surfaces level the playing field, giving outer traps a boost of up to 4 % in win percentage. The mud sucks the speed out of the inside lanes, and suddenly trap 4 looks like a sweet spot. Ignoring weather trends is a rookie mistake.

Greyhound Profiles

And here is why pedigree matters. Sprint specialists thrive in trap 1, leveraging their explosive start. Stayers, on the other hand, often prefer middle traps where they can settle into a rhythm before the final bend. Mixing a sprinter’s raw power with a stayer’s endurance in the same race can skew the trap odds dramatically.

Betting Implications

Fast money isn’t just about the favourite; it’s about the trap premium. If you spot a strong runner in trap 5 on a dry day, you’re probably overpaying. The smart punter backs the runner’s form first, then layers the trap advantage on top. That layered approach yields a 12 % edge over the market.

Tools and Resources

Don’t reinvent the wheel. Use the comprehensive guide at https://fastgreyhoundresults.com/articles/uk-greyhound-trap-statistics/ to drill into each track’s historical trap performance. It’s a goldmine of heat-maps, win ratios, and even jockey-style commentary on how dogs handle each lane.

Actionable Takeaway

Next time you set up a bet, check the trap win rate, adjust for weather, and match the dog’s running style to the lane. That three-point checklist is the shortcut to turning trap statistics into profit. Go.

UK Trap Bias Data by Track Greyhound

Why the Numbers Matter

Look: every time a greyhound bursts from the starting boxes, the odds are already skewed by the trap it occupies. The bias isn’t some myth whispered in back-rooms; it’s a cold, hard data set that can make or break a bettor’s bankroll. The UK tracks each season hand-craft a matrix of trap performance, and those matrices whisper secrets to anyone who listens.

Decoding the Bias

Here is the deal: trap 1 on a tight, left-handed circuit often favours front-runners, while trap 5 on a sprawling oval can hand a late-closing dog a golden ticket. It’s not a one-size-fits-all rule; each venue has its own personality, its own quirks, its own “sweet spot” where the grass, the camber, and the wind conspire.

Data Sources

By the way, the most reliable source is the official racecard analytics, but the real gold lies in the raw times logged by the track’s timing system. Those timestamps, when plotted against trap numbers, reveal a pattern that repeats like a broken record.

Statistical Edge

And here is why you should care: a simple regression on trap-win percentages can boost your expected value by 3-5 %. In a market where margins are razor-thin, that edge is the difference between a weekend hobby and a sustainable side hustle.

Applying the Insight

First, isolate the track. Don’t lump Ascot together with Crayford; each has a distinct bias curve. Then, filter the horses by their historical trap performance. A dog that consistently excels from trap 4 at Wimbledon is a safe bet when the draw lands it there again.

Second, adjust your staking plan. If the data shows trap 2 is a dead-weight at a particular venue, shave a percentage off any bet that relies on that trap. Conversely, double-up on a dog that thrives in trap 6 on the same day.

Finally, stay hungry for updates. Biases shift with track resurfacing, weather, and even changes in the starting box mechanisms. Treat the data like a living organism — feed it fresh numbers, and it will reward you with crisp, profitable odds.

For a deep dive into the raw numbers and how to translate them into a betting strategy, check out UK trap bias data by track greyhound.

Bottom line: ignore trap bias at your own peril; exploit it, and the racetrack will hand you the keys to the vault.

Romford Greyhound Stadium Betting Guide and Track Profile

Why Romford Matters Now

Look: the market’s shifting, and Romford is the hotbed where odds melt into profit if you know the lay of the land. Miss the nuance and you’ll watch your stake evaporate faster than a summer puddle.

Track Layout – The Blueprint

Here’s the deal: Romford’s 440-metre oval is a tight, unforgiving curve that punishes any greyhound lacking early speed. The bends tighten like a fist, forcing trainers to perfect the break-off. The home straight, a 120-metre sprint, is where the race is won or lost – a catapult for any dog that can hold a lead.

Surface Secrets

By the way, the sand composition is a proprietary mix of silica and loam, providing just enough give to cushion a dog’s stride but firm enough to keep momentum. Weather plays a sneaky role; a damp night can turn the track into a slick runway, benefitting dogs with a low centre of gravity.

Betting Angles You Can’t Ignore

First, ignore the flashy odds on the front page. The real value lives in the “each-way” market for long-shot sprinters who have shown a knack for early bursts. Second, track the “trap draw” – the inside traps (1-3) dominate the stats, but a smart punter watches for a “trap-swap” where a mid-track dog gets a surprisingly fast break.

Form and Trainer Trends

And here is why the trainer’s record matters: those who specialize in sprint distances at Romford have a 15% higher win rate. Scan the form for dogs that have run a 23.5-second 300-metre split; they often convert that speed into a winning 440-metre effort.

Live Betting Tactics

When the race is on, keep your eyes on the “in-running” odds. A sudden dip in the favorite’s price can signal a late-stage slip, opening a window for a quick back-to-lay flip. Also, watch the “dead heat” odds – they’re a goldmine for hedging when two dogs are neck-and-neck at the finish line.

Where to Find the Full Breakdown

For the complete guide, including insider stats and a downloadable track map, check out https://betongreyhoundsuk.com/articles/romford-greyhound-stadium-betting-guide-and-track-profile/.

Actionable Move

Grab the latest form sheet, pick a mid-track trap with a proven early split, and place an each-way bet before the 15-minute cutoff – that’s the edge you need.